
What is Power BI? A Strategic Guide for Australian Business Leaders in 2026
- jonesaqayalo
- Mar 22
- 14 min read
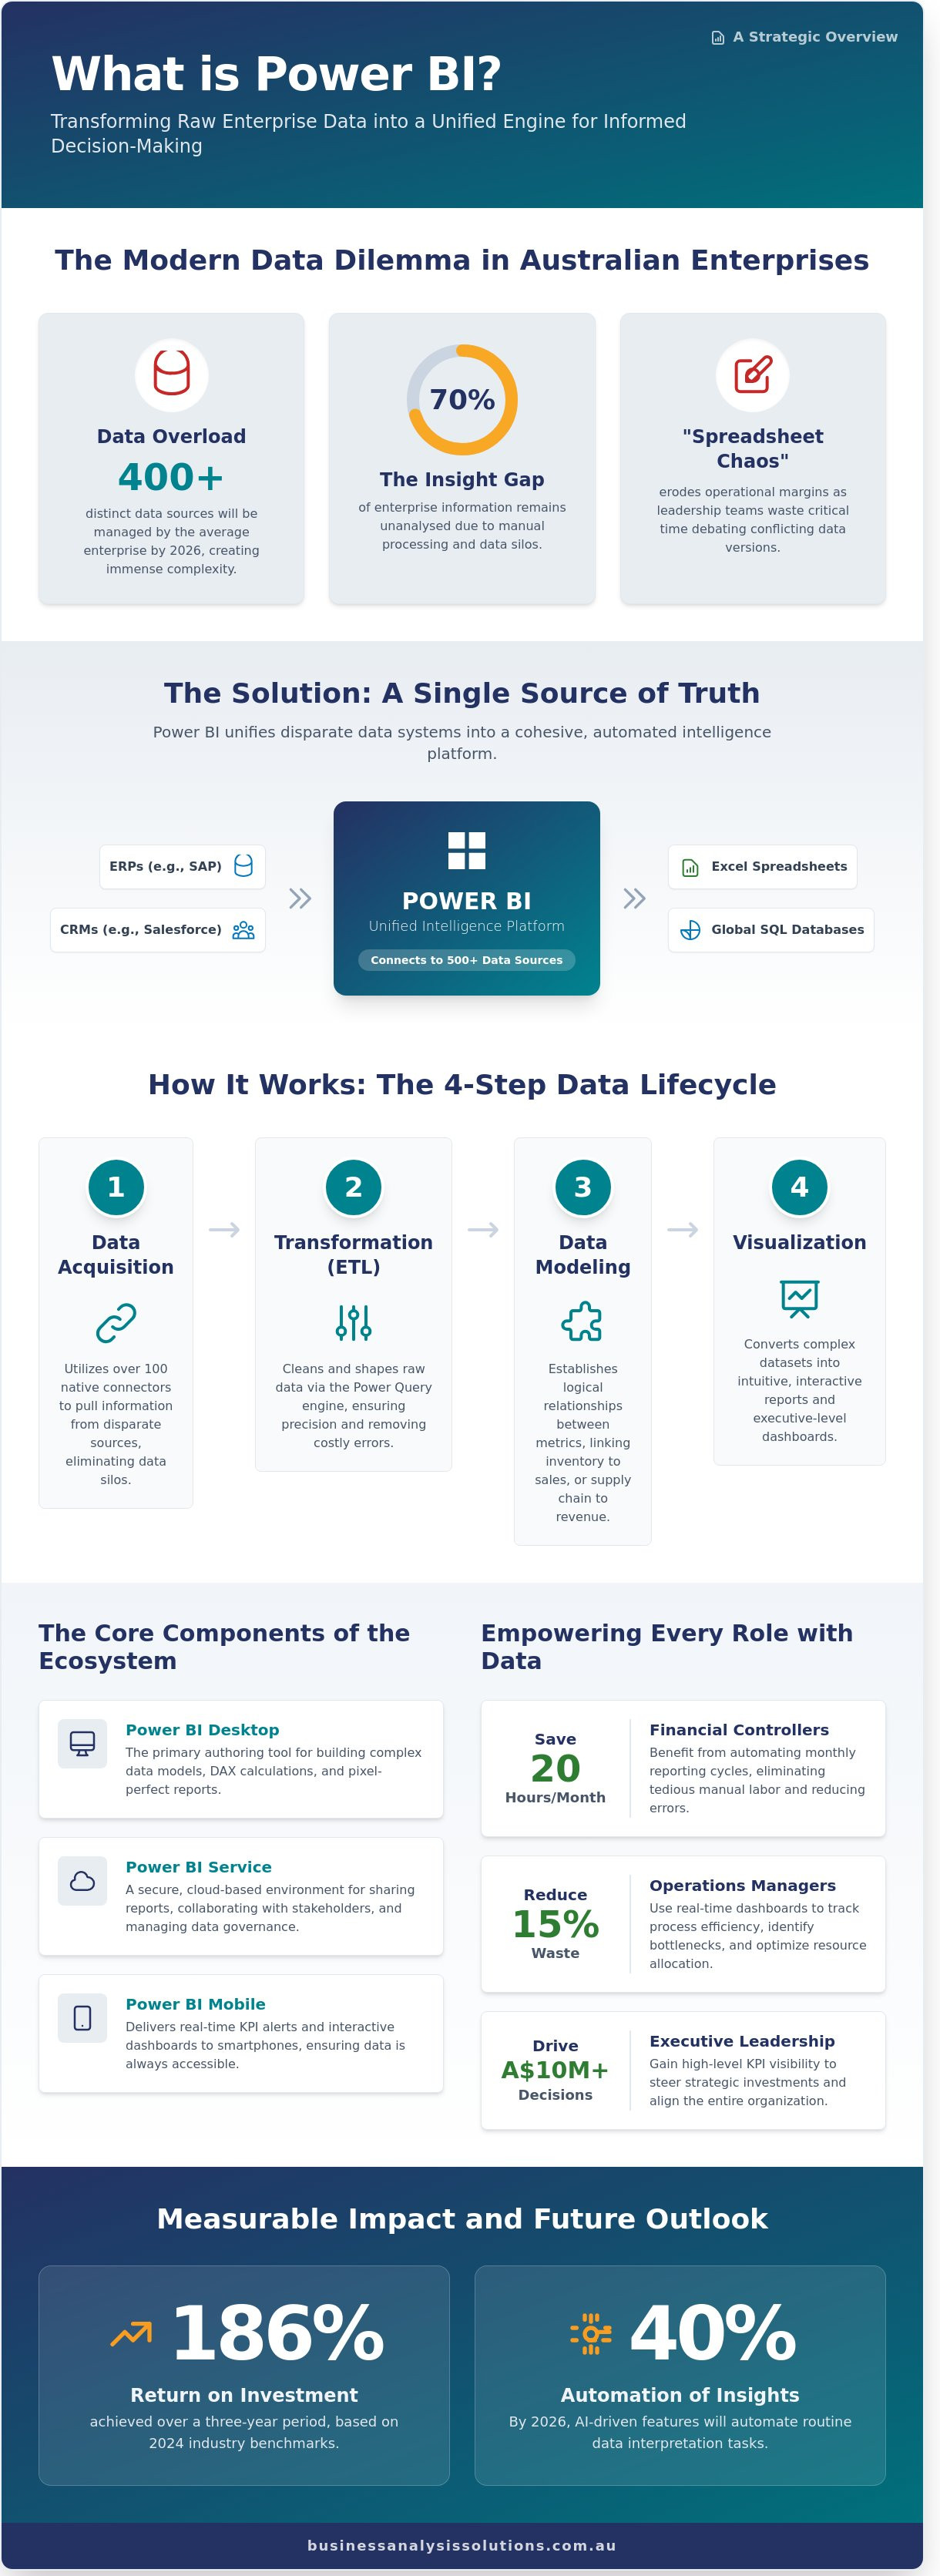
By 2026, the average Australian enterprise will manage over 400 distinct data sources, yet 70% of that information remains unanalysed due to manual processing bottlenecks. If your leadership team still spends the first twenty minutes of every meeting debating which spreadsheet has the correct figures, you aren't just losing time; you're eroding your operational margin. Gaining a precise understanding of what is Power BI is no longer a technical luxury. It's a strategic requirement for any firm seeking to establish a single source of truth across its financial and operational KPIs within the A$2.3 billion local analytics market.
You've likely felt the frustration of reporting cycles that take too long and deliver insights that are already outdated. This guide demonstrates how to transform those fragmented systems into an automated engine for informed decision-making. We'll provide a clear roadmap to move your organisation from manual data entry to real-time strategic insights, ensuring your digital strategy aligns with professional business analysis standards to deliver a tangible return on investment.
Key Takeaways
Understand what is power bi within the modern Microsoft Fabric ecosystem and how it serves as a unified intelligence platform for Australian enterprises.
Learn the systematic process of data acquisition and transformation that converts disparate ERP and CRM inputs into accurate, executive-level dashboards.
Discover how to eliminate "spreadsheet chaos" by integrating Power BI’s automated scalability with Excel’s familiarity to achieve a higher standard of data integrity.
Identify why rigorous requirements elicitation is the essential first step in ensuring your BI tools drive measurable operational efficiency and ROI.
Position data-driven insights as a pillar of your digital transformation blueprint to facilitate better strategic alignment across your entire organization.
Table of Contents Defining Power BI: More Than Just a Data Visualization Tool How Power BI Works: From Raw Data to Executive Dashboards Power BI vs. Excel: Solving the "Spreadsheet Chaos" Problem Strategic Implementation: Ensuring Your Data Drives Real Efficiency Beyond the Software: Integrating Power BI into Your Digital Strategy
Defining Power BI: More Than Just a Data Visualization Tool
To understand what is power bi, one must look beyond basic chart generation. It is a unified business intelligence platform that facilitates the translation of raw data into strategic outcomes. Since the 2023 integration with Microsoft Fabric, Microsoft Power BI has functioned as the primary consumption layer for data-driven organizations. It doesn't just display numbers; it identifies trends and anomalies that directly impact a company's bottom line. By connecting to over 500 data sources, including local Excel files and global SQL databases, it creates a single source of truth that eliminates the ambiguity often found in fragmented reporting systems.
Precision is the core of this tool. For a business in Australia, the ability to monitor real-time logistics or financial performance can lead to a 186 percent return on investment over a three-year period, according to 2024 industry benchmarks. It bridges the gap between technical requirements and business objectives. When we discuss what is power bi in a professional context, we're referring to a solution that enables process mapping and strategic alignment. It moves an organization from a reactive state to a proactive one by providing the clarity needed for complex problem-solving. This isn't about making data look pretty. It's about making data work for the business.
The Core Components of the Power BI Ecosystem
Power BI Desktop serves as the primary authoring tool for building complex data models and DAX calculations. The Power BI Service provides a secure, cloud-based environment for stakeholder engagement and report sharing. For leaders on the move, Power BI Mobile delivers real-time KPI alerts directly to smartphones. This three-part structure ensures that data remains accessible whether you're in a Sydney boardroom or at a remote site in Western Australia.
Who is Power BI For?
Executive leadership relies on the tool for high-level KPI visibility to drive A$10 million+ investment decisions. Operations managers use it to track process efficiency, often reducing waste by up to 15 percent. Financial controllers benefit from automating monthly reporting cycles, which can save 20 hours of manual labor per month. It's a versatile solution designed for any professional who values empirical evidence over intuition and seeks to optimize organizational performance.
This data-driven approach extends to human resources, where understanding the employee journey is critical. While general BI tools are powerful, specialized platforms like Benchmarcx provide focused insights by allowing businesses to measure and benchmark their talent experience in real-time.
The role of this platform within the Microsoft Fabric ecosystem is transformative. It allows for seamless integration with Data Factory and Synapse, ensuring that data engineering and data science teams work in tandem with business analysts. This level of technical cohesion was previously unattainable for many mid-sized Australian firms. By 2026, the tool's AI-driven insights will likely automate up to 40 percent of routine data interpretation tasks. This isn't just a software choice. It's a commitment to a methodical, logical approach to organizational growth and operational efficiency. The result is a more resilient and responsive business model.
How Power BI Works: From Raw Data to Executive Dashboards
To understand what is power bi, one must view it as a structured pipeline that converts raw operational inputs into strategic assets. The platform functions through a five-step lifecycle designed to ensure data integrity and accessibility. This process begins with Data Acquisition. Power BI utilizes over 100 native connectors to pull information from disparate sources, including ERP systems like SAP, CRM platforms like Salesforce, and local Excel files containing A$ revenue targets. This eliminates the silo effect that often hinders Australian mid-market enterprises.
Once connected, the Transformation (ETL) phase begins via the Power Query engine. Here, analysts clean and shape data by removing duplicates, fixing formatting errors, and filtering out irrelevant noise. Precision at this stage is vital; a 2% error in data entry can lead to a A$20,000 discrepancy in monthly forecasting. Following transformation, Data Modeling establishes logical relationships between different business metrics. For example, linking inventory levels to regional sales performance allows leaders to see the direct impact of supply chain delays on the bottom line.
The fourth stage is Visualization. This is where complex datasets become intuitive, interactive reports. By understanding Power BI's applications, users can design dashboards that highlight Key Performance Indicators (KPIs) through heat maps, decomposition trees, and trend lines. The final step is Distribution. Reports are published to the Power BI Service, a cloud-based environment where stakeholders can access insights securely from any device, ensuring that every decision-maker operates from the same information.
The Power of Automated Data Refresh
Manual data entry is a primary source of corporate risk. In 2024, Australian firms reported that manual reporting errors cost an average of 15 hours per week in administrative overhead. Power BI solves this through scheduled refreshes. You can configure reports to update up to eight times daily on a Pro license, or more frequently with Premium capacity. This ensures that by the time a 2026 business meeting begins, the data is current to the hour. Real-time visibility allows for immediate pivots, turning a reactive reporting culture into a proactive strategic advantage. Organizations that move away from static spreadsheets often see a 30% increase in reporting efficiency within the first quarter.
Security and Governance in the Cloud
Data sovereignty is a critical concern for Australian businesses. Power BI aligns with the Australian Privacy Principles (APP) by offering robust security features like Row-Level Security (RLS). This allows a firm to share a single report with the entire country while ensuring a manager in Perth only sees Western Australian figures, while the CFO sees the full A$ national consolidated view. This granular control maintains a "Single Source of Truth," preventing the common issue where different departments present conflicting numbers. Establishing these governance frameworks ensures that data integrity remains uncompromised as the organization scales. It's a methodical approach to risk management that protects sensitive financial data while empowering staff with the insights they need to perform.
The logic behind what is power bi is simple: it bridges the gap between technical data storage and business objectives. It's not just a reporting tool; it's a mechanism for organizational clarity. By following this structured flow from acquisition to distribution, businesses replace ambiguity with evidence-based certainty.
Power BI vs. Excel: Solving the "Spreadsheet Chaos" Problem
Most Australian finance teams spend up to 80% of their time manually consolidating data from various departments. This reliance on manual entry creates "Spreadsheet Chaos," a state where logic errors and broken links compromise strategic decisions. Research indicates that 88% of spreadsheets contain significant errors, a risk that increases exponentially as data sets expand. Understanding what is power bi involves recognising it as a direct solution to these structural vulnerabilities. It moves an organisation from static, error-prone files to a robust, automated environment where data integrity is guaranteed through programmed logic.
Understanding what is power bi in relation to your existing Excel workflows is essential for strategic planning. Power BI isn't a replacement for Excel; they are powerful alone but better together. Excel remains the premier tool for deep-dive cell manipulation and one-off financial modelling. However, Microsoft Power BI excels at aggregating disparate data sources into a single source of truth. It handles billions of rows of data, far exceeding Excel's technical limit of 1,048,576 rows. In an Australian business environment where rigorous compliance with GST and payroll reporting is mandatory, linking Excel's granular calculations into a Power BI model ensures both precision and high-level oversight.
Version control remains a critical failure point for traditional spreadsheets. Emailing attachments leads to "Final_v2" and "Final_v3" files circulating simultaneously, causing different departments to report conflicting figures for the same KPI. Power BI resolves this by hosting dashboards in a secure cloud environment. Every stakeholder views the same live data, updated automatically via scheduled refreshes. This ensures the Chief Financial Officer and the Sales Manager operate from identical numbers. It replaces the "push" model of emailing files with a "pull" model where users access real-time insights on demand.
When to Stick with Excel
Excel is the logical choice for ad-hoc, one-off calculations or personal task tracking. If a project requires a simple "sandbox" to test a formula before a full-scale deployment, Excel provides the necessary flexibility. It remains ideal for individual tasks that don't require broad stakeholder visibility. Use it for small-scale data manipulation where the dataset remains under 100,000 rows and doesn't require automated integration with external software or live web services.
When Your Business Has Outgrown Spreadsheets
Transition to a dedicated BI tool when data preparation consumes more than 10 hours of your week. If your team spends Monday and Tuesday just cleaning data to present a report on Wednesday, your process is inefficient. You've outgrown spreadsheets if your data exceeds 500,000 rows or if you need to track trends across five years of historical performance. When a monthly subscription for Power BI Pro costs roughly A$15 per user, the return on investment through time saved is immediate. For an Australian business with 20 employees, this small investment can save 40 hours of manual labour per month. Discrepancies between departmental reports are the final signal that a centralized BI solution is mandatory for operational clarity and long-term scalability.
Strategic Implementation: Ensuring Your Data Drives Real Efficiency
Software doesn't fix a broken process; it only accelerates it. When organisations ask what is power bi, they often view it as a standalone solution for operational lag. True efficiency stems from a structured methodology that precedes any technical configuration. A Business Efficiency Diagnostic serves as the foundational phase, identifying where bottlenecks exist before a single line of code is written. This diagnostic ensures that the subsequent technical build targets high-impact areas that directly affect the bottom line. Research from 2023 indicates that 80% of data initiatives fail not because of technical limitations, but due to a lack of business alignment.
Precision in requirements elicitation distinguishes successful deployments from abandoned projects. This phase involves deep-dive interviews and process mapping to ensure the technical architecture mirrors the operational reality. Without this step, dashboards often become expensive digital paperweights. We focus on the "why" before the "how," ensuring every data point serves a logical purpose. This methodical approach prevents the common mistake of building reports that look sophisticated but fail to provide the clarity required for high-stakes decision-making.
Actionable metrics must take precedence over vanity metrics. A report showing 50,000 monthly site visits might look impressive on a screen, but it's a vanity metric if it doesn't correlate to revenue. An actionable metric, such as an A$450 average cost per acquisition across specific NSW regions, provides the clarity needed for resource allocation. Similarly, in specialized fields like transport planning, stakeholders might need to explore Traffic Impact Assessment (TIA) Report data to make informed decisions about infrastructure. By filtering out the noise, leaders can focus on the 20% of data that drives 80% of their results. This focus on pragmatism ensures that what is power bi provides for your company is a tool for growth, not just a gallery of charts.
Turning these actionable metrics into a coherent growth strategy is precisely where data analytics meets business consulting. Expert firms like Human Instinct specialize in using these kinds of data-driven insights to help companies refresh stagnant brands or identify entirely new audiences.
The Importance of Stakeholder Engagement
Engaging business leaders ensures that the data visuals align with specific objectives. If a CFO needs to monitor cash flow volatility, the dashboard shouldn't bury that data under layers of marketing metrics. Intuitive design and targeted training are non-negotiable for high user adoption rates. We've seen adoption rates jump from 15% to 85% when stakeholders are involved in the design phase. Mapping visuals to outcomes creates a sense of ownership across the organisation.
This clarity is also vital when communicating these data-driven successes externally. For organizations focused on demonstrating their impact, translating complex performance data into compelling visual stories is a key part of their digital marketing strategy, a service offered by specialists like The Ethical Agency.
For a more comprehensive, data-driven approach that integrates all aspects of your online presence, it's worth exploring a full-service agency. If you want to see how this works in practice, you can check out DNA Digital Marketing.
Avoiding Common Implementation Pitfalls
Building reports on unorganized data leads to immediate loss of trust. If the source data is "dirty," the insights will be flawed. Over-complicating visuals is another frequent error; a dashboard with 15 charts is often less effective than one with four clear indicators. Finally, failing to define data governance leads to "version conflict," where different departments report different numbers for the same KPI. Clear ownership of data sources is essential for maintaining a single version of the truth.
Ready to transform your organisational data into a strategic asset? Our experts provide the professional business analysis solutions you need to drive measurable efficiency.
Beyond the Software: Integrating Power BI into Your Digital Strategy
Adopting a new reporting tool often fails because leadership views it as a standalone IT project rather than a core pillar of a Digital Transformation Blueprint. To drive real value, you must position these analytics at the centre of your operational logic. According to a 2023 report by Deloitte Australia, 72% of local firms that successfully scaled their operations cited data accessibility as their primary driver for growth. When you understand what is power bi in a strategic context, it becomes the mechanism that facilitates Strategic Alignment across your entire organisation. It ensures that your finance team in Sydney and your logistics hub in Perth are looking at the exact same numbers in real time.
A methodical approach to technology adoption prevents the common pitfall of "data for data's sake." We advocate for a logic-rooted strategy where every dashboard serves a specific business objective. This is where the role of a Fractional CIO becomes vital. Most Australian SMEs don't require a full-time Chief Information Officer, yet they desperately need executive-level oversight to manage BI maturity. A Fractional CIO ensures your technical architecture supports your commercial goals, preventing the fragmented "data silos" that cost Australian businesses an estimated A$15,000 per employee in lost productivity annually, based on 2024 industry benchmarks. They bridge the gap between complex technical requirements and clear business outcomes.
Power BI and the Microsoft Power Platform
The true power of the ecosystem emerges when you integrate Power BI with Power Automate. This synergy allows your business to move from passive observation to automated action. If your dashboard identifies that a project's budget has exceeded its 85% threshold, Power Automate can instantly trigger a notification to the project manager or pause non-essential procurement. For a Perth-based business, this creates a holistic digital ecosystem where data insights drive immediate process automation implementation. You aren't just looking at what happened; you're controlling what happens next.
Next Steps for Your Business
Implementation must be sequenced to ensure a high return on investment. Start with a diagnostic to identify your highest-value data opportunities. We recommend focusing on areas where a 5% to 10% efficiency gain will have the most significant impact on your bottom line. Once these are identified, develop a roadmap that prioritises quick wins, such as automating manual weekly sales reports, before moving toward long-term scalability. This structured path reduces risk and builds internal buy-in.
Professional business analysis is the bridge between what is power bi as a software and what it becomes as a competitive advantage. You need a partner who understands the Australian market conditions and the specific regulatory requirements of your industry. By consulting with a strategic partner, you ensure that your digital strategy is grounded in precision and reliability. Don't leave your digital transformation to chance. Start with a clear plan, lean on expert oversight, and turn your organisational complexities into a streamlined, data-driven engine for growth.
Future-Proofing Your Australian Data Strategy
Transitioning from fragmented Excel sheets to a unified reporting environment isn't just a software upgrade; it's a strategic shift. By 2026, Australian firms that fail to integrate real-time reporting into their digital strategy risk losing their competitive edge. Understanding what is Power BI allows you to move beyond static data toward actionable insights that drive measurable ROI. You'll eliminate manual reporting errors and ensure every department aligns with your overarching commercial goals through a structured, methodical approach.
Business Analysis & Solutions brings over 20 years of industry experience to help you bridge the gap between technical IT requirements and your core business objectives. We're a boutique Perth-based consultancy with national reach, focused on delivering precise, logical outcomes for complex organisations. We don't just implement software; we build the frameworks that turn raw data into a functional asset for your leadership team. Our focus remains on clarity, reliability, and the elimination of organizational ambiguity.
Your journey toward a more data-literate organization starts with a single, structured step toward operational clarity.
Frequently Asked Questions
Is Power BI free to use for small businesses?
Power BI Desktop is free for individual use, but professional collaboration requires a paid license. For most Australian small businesses, the Power BI Pro license costs A$13.70 per user per month. This allows your team to publish reports and share insights across the organisation securely. If you only need to create reports for your own analysis on a single machine, the free version covers 100% of those requirements.
How long does it typically take to implement Power BI?
A standard implementation typically spans 2 to 6 weeks for initial deployment. A basic dashboard connecting to a single source like Xero often reaches completion within 10 business days. Complex enterprise projects involving multiple legacy systems and extensive data cleansing may require 12 weeks of strategic alignment and technical configuration. We focus on delivering a minimum viable product within the first 21 days to ensure immediate ROI.
Do I need a full-time data scientist to run Power BI?
You don't need a full-time data scientist to manage your analytics. Most Australian firms successfully operate the platform using existing business analysts or finance professionals who have undergone 2 days of targeted training. While a data scientist assists with complex predictive modelling, 85% of business requirements involve descriptive analytics that your current team can handle. We provide the initial architecture so your staff can manage daily reporting independently.
Can Power BI connect to my specific accounting software or CRM?
Power BI connects to over 500 data sources, including Australian favourites like Xero, MYOB, and Salesforce. It uses native connectors to pull live data, ensuring your financial reports are accurate to the minute. If you use a niche proprietary system, we use API integrations or SQL database connections to bridge the gap. This ensures 100% of your critical business data is accessible within a single, unified interface.
What is the difference between Power BI Pro and Power BI Premium?
Power BI Pro is a per-user license costing A$13.70 monthly, designed for self-service analytics and sharing. Power BI Premium is available either at A$27.50 per user or as a dedicated capacity starting at A$6,858.10 per month for large-scale deployments. Premium offers advanced AI capabilities and 100 TB of storage, compared to the 10 GB limit in Pro. Most Australian SMEs find the Pro version meets 95% of their operational needs.
How secure is my business data when using Power BI?
Your data is protected by Microsoft's enterprise-grade security, which includes AES 256-bit encryption and compliance with the Australian Privacy Principles. Power BI uses Azure Active Directory for identity management, ensuring only authorised personnel access sensitive reports. You can restrict data visibility down to the individual row level, meaning a regional manager only sees figures for their specific 2024 sales territory while the CEO views everything.
Can Power BI work with my existing Microsoft 365 subscription?
Power BI integrates natively with Microsoft 365, and it's often already included in E5 subscriptions. If you're wondering what is power bi in the context of your existing stack, it's the analytical layer that turns your Excel and SharePoint data into interactive visuals. You can embed reports directly into Microsoft Teams or PowerPoint, which reduces the time spent switching between applications by approximately 30% for the average user.
What happens if our data is currently messy or unorganised?
Messy data is a standard starting point for 75% of our consulting engagements. We use the Power Query engine to automate the extraction, transformation, and loading process, which cleans and reshapes your information. This removes the need for manual data entry and corrects inconsistencies in your records. By establishing a single source of truth, we reduce reporting errors by up to 40% within the first month of implementation.


Comments